CBAM for Indian aluminium exporters — handled. Free this quarter.
Indian aluminium carries the steepest CBAM cost of any sector — up to $1,600 per tonne — because smelting needs vast amounts of electricity, and 54% of Indian capacity runs on coal. This quarter, CarbonSettle does your entire aluminium CBAM for you, free — a dedicated expert and our AI turn your captive-power and process data into a buyer-ready report. The report is yours to keep.
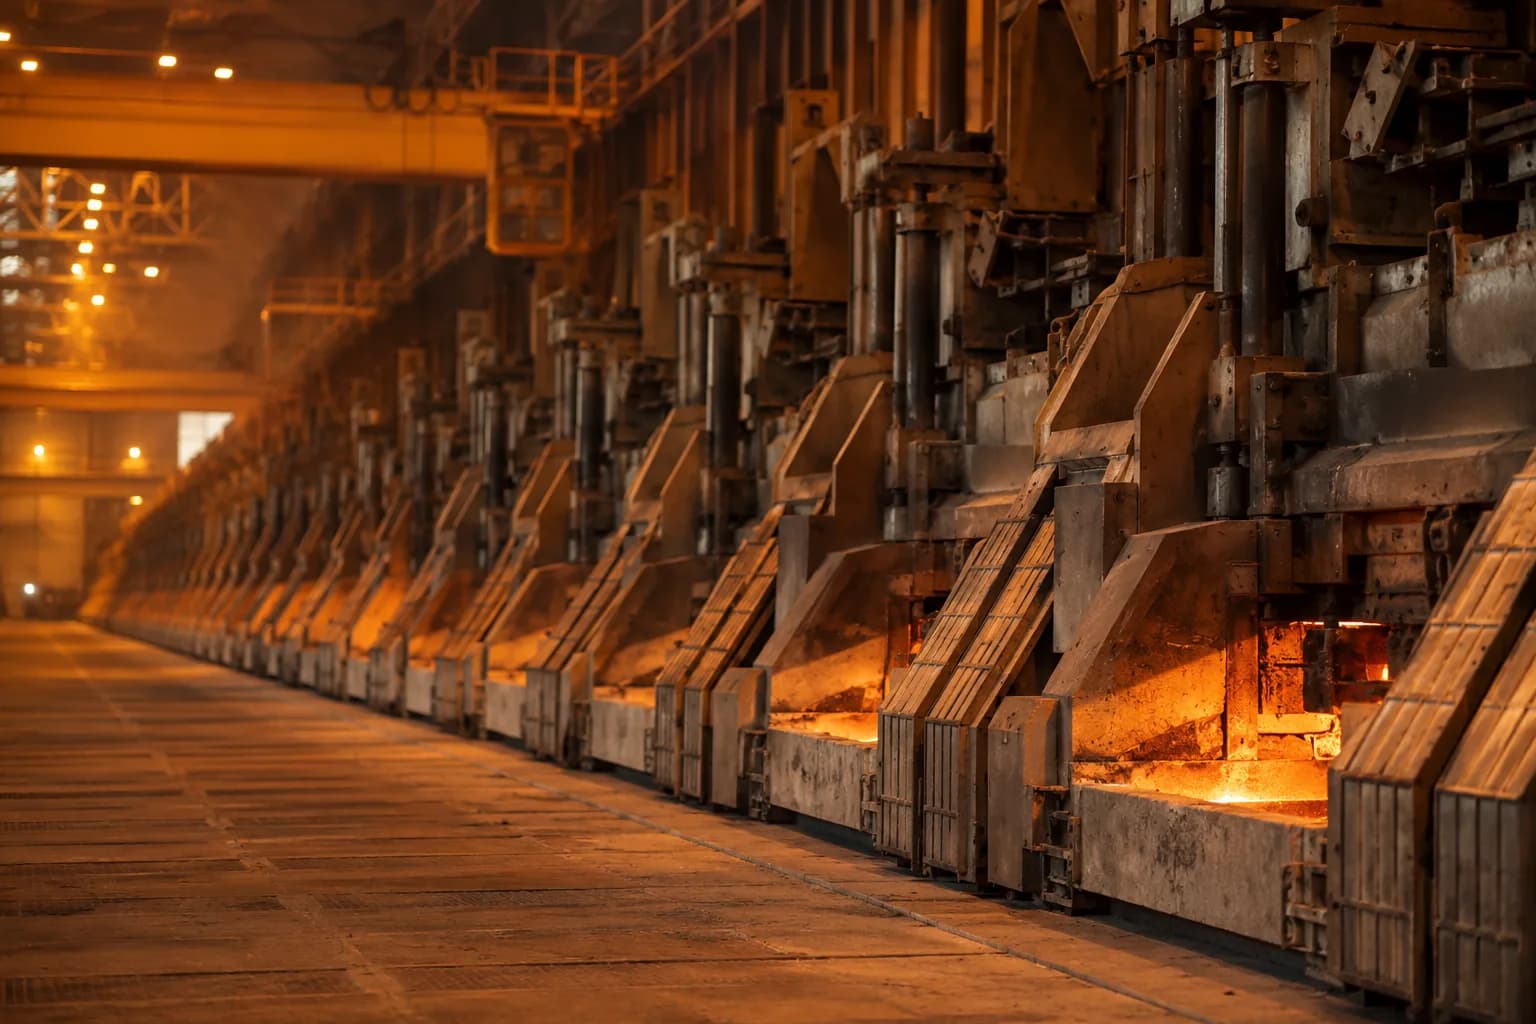
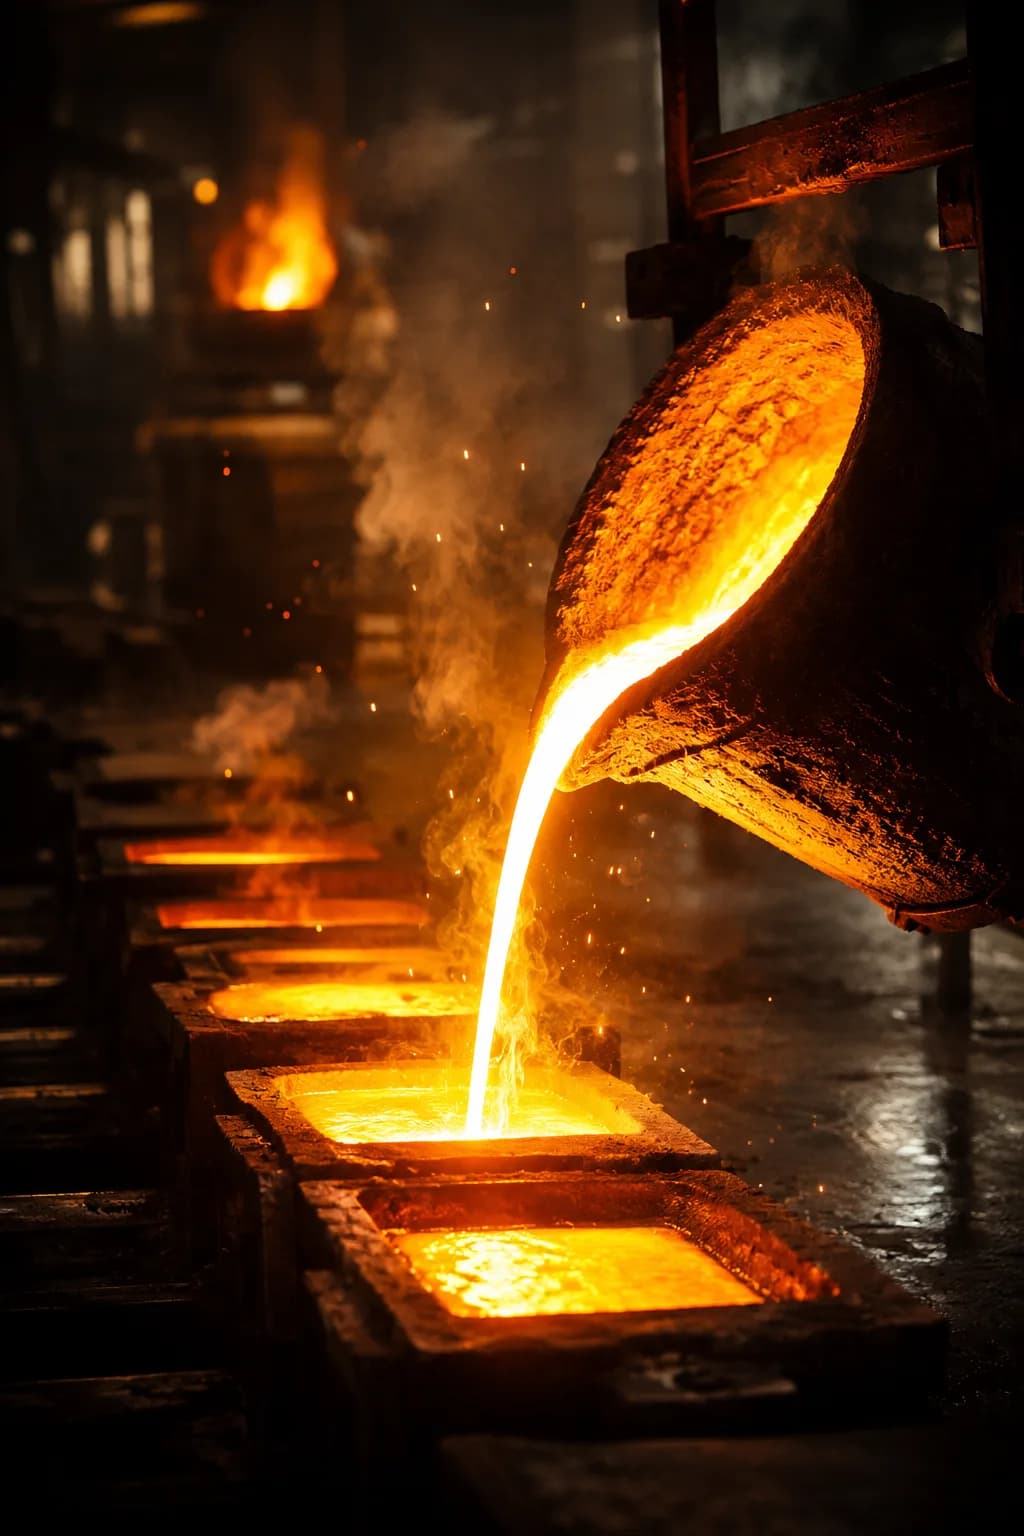
One tonne of aluminium. Fifteen thousand kilowatt-hours.
Primary aluminium smelting consumes ~14,000–15,000 kWh per tonne. In Europe, that's hydro. In India, more than half the capacity is on captive coal — pushing Scope 2 to 10–14 tCO₂ per tonne and making Indian primary 2–3x more emission-intensive than the EU.
But hydro-powered Indian smelters (Hirakud, captive renewables) hit 4–7 tCO₂ — competitive with the EU. The catch: if you don't submit verified actuals, the EU defaults assume the worst — and your buyer overpays by ₹2.5–3.8 crore per 1,000 tonnes.
Eight aluminium product groups covered by CBAM
All aluminium products under CN code 76. If you export any of these to the EU, CBAM compliance is mandatory from January 2026.
| CN code | Product category | Risk |
|---|---|---|
| 7601 | Unwrought Aluminium (Primary & Secondary) | Very High |
| 7603 | Aluminium Powders & Flakes | High |
| 7604 | Aluminium Bars, Rods & Profiles (Extrusions) | High |
| 7605 | Aluminium Wire | Medium |
| 7606 | Aluminium Plates, Sheets & Strip | High |
| 7607 | Aluminium Foil | High |
| 7608 | Aluminium Tubes & Pipes | Medium |
| 7609–7616 | Aluminium Structures, Containers, Articles | Medium |
Your route — coal, hydro, or scrap — decides your bill.
tCO₂ per tonne of aluminium. Savings calculated per 1,000 t at ~€80/t CO₂.
Representative midpoints. Note how hydro-powered Indian smelters sit far below the EU default — that entire red zone is overpayment unless verified actuals are filed.
| Production type | India typical | EU average | EU default value | Savings with actuals |
|---|---|---|---|---|
| Primary Smelting (Coal Power) | 14.0–18.0 | 6.0–8.0 | 20.0+ | ₹1.2–1.8 Cr |
| Primary Smelting (Captive Hydro/Renewable) | 4.0–7.0 | 2.0–4.0 | 20.0+ | ₹2.5–3.8 Cr |
| Secondary (Scrap-Based) | 0.5–1.5 | 0.3–0.8 | 3.0+ | ₹48–72 lakh |
| Extrusion / Fabrication | 1.0–3.0 | 0.5–1.5 | 5.0+ | ₹60–96 lakh |
Hydro-powered smelters: don't let defaults erase your advantage
Indian smelters on hydroelectric power emit 4–7 tCO₂/t — competitive with the EU. Without verified actuals submitted to the EU, defaults assume 20+ tCO₂/t. That's an overpayment of ₹2.5–3.8 Cr per 1,000 t. CarbonSettle documents and verifies your real Scope 2.
Indian aluminium clusters we serve
From primary smelters to downstream extrusion and foil — we know each region's power mix and grid factor before we walk in.
Angul–Jharsuguda
Primary smelting (Vedanta, NALCO)
India's largest aluminium production belt — captive coal power drives high Scope 2
Very High riskKorba
Bharat Aluminium Company (BALCO)
Vedanta-owned smelter with captive coal-based thermal power
Very High riskHirakud
Hindalco primary smelting
Hydro-electric powered smelter — lower Scope 2 than coal-based plants
High riskRenukoot
Hindalco integrated complex
One of India's oldest aluminium smelters with integrated operations
High riskSilvassa–Daman
Extrusion and fabrication hub
100+ aluminium extrusion units — major EU export hub for profiles and sections
Medium riskChennai–Madurai
Foil, sheets, auto components
Growing cluster for aluminium flat products and automotive components
Medium riskFive steps, one named expert, Scope 2 done right.
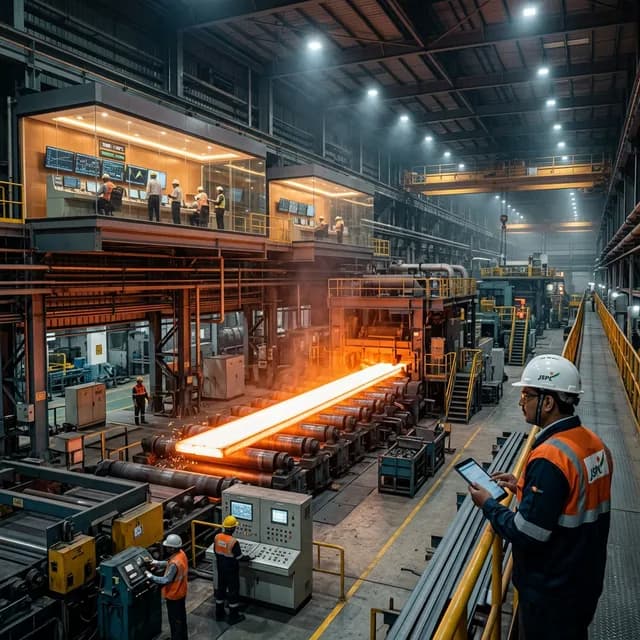
You share your factory documents. We deliver an EU-ready, declarant-friendly report — pre-verified by a top-3 EU auditor.
- 01
Smelter boundary mapping
We map your aluminium production — electrolysis pots, anode bake furnaces, casthouse, rolling mills — to identify every Scope 1 source and every electricity-consuming asset.
- 02
Electricity and fuel data collection
Captive power plant data (coal consumption, generation records) or grid electricity bills. For captive power, we compute the actual emission factor of your power source — not the grid average. This single move saves crores.
- 03
Emission calculation (Scope 1 + Scope 2)
Anode-effect PFCs and fuel combustion plus the dominant Scope 2 electricity term — typically 60–80% of your CBAM cost.
- 04
Precursor and alumina data
If you produce alumina from bauxite, we calculate the Bayer process upstream. If you purchase alumina, we chase supplier emission data through automated multi-language follow-ups.
- 05
EU XML, declarant handoff, verifier replies
We generate the EU CBAM XML, coordinate with your buyer's Authorised Declarant, prep audit documentation, and handle verifier queries. Your competitive position stays protected.

What will CBAM cost your shipments?
Pick your product, drop your number — a named CBAM expert sends your estimate on WhatsApp the same day, in your language. No forms, no software, no obligation.
Aluminium CBAM, in plain English
Which aluminium products are covered under CBAM?
▼
Why is CBAM particularly expensive for Indian aluminium?
▼
How are embedded emissions calculated for aluminium?
▼
Do secondary aluminium (scrap-based) producers need to comply?
▼
How can Indian aluminium exporters reduce CBAM costs?
▼
Your entire aluminium CBAM, done for you. Free.
Primary smelter, extrusion plant or foil maker — this quarter we handle your full CBAM for free, verifying your real Scope 2 and saving your EU buyer crores against EU defaults. The report is yours to keep, with no commitment beyond this quarter.