CBAM for Indian cement exporters — handled. Free this quarter.
Sixty per cent of cement's carbon comes from chemistry, not fuel — CaCO₃ → CaO + CO₂ — and Indian blended cements (PPC, PSC) are leaner than EU defaults assume. This quarter, CarbonSettle does your entire cement CBAM for you, free — a dedicated expert and our AI prove your actual numbers in a buyer-ready report. The report is yours to keep.
Sixty per cent of cement's carbon is chemistry — not fuel.
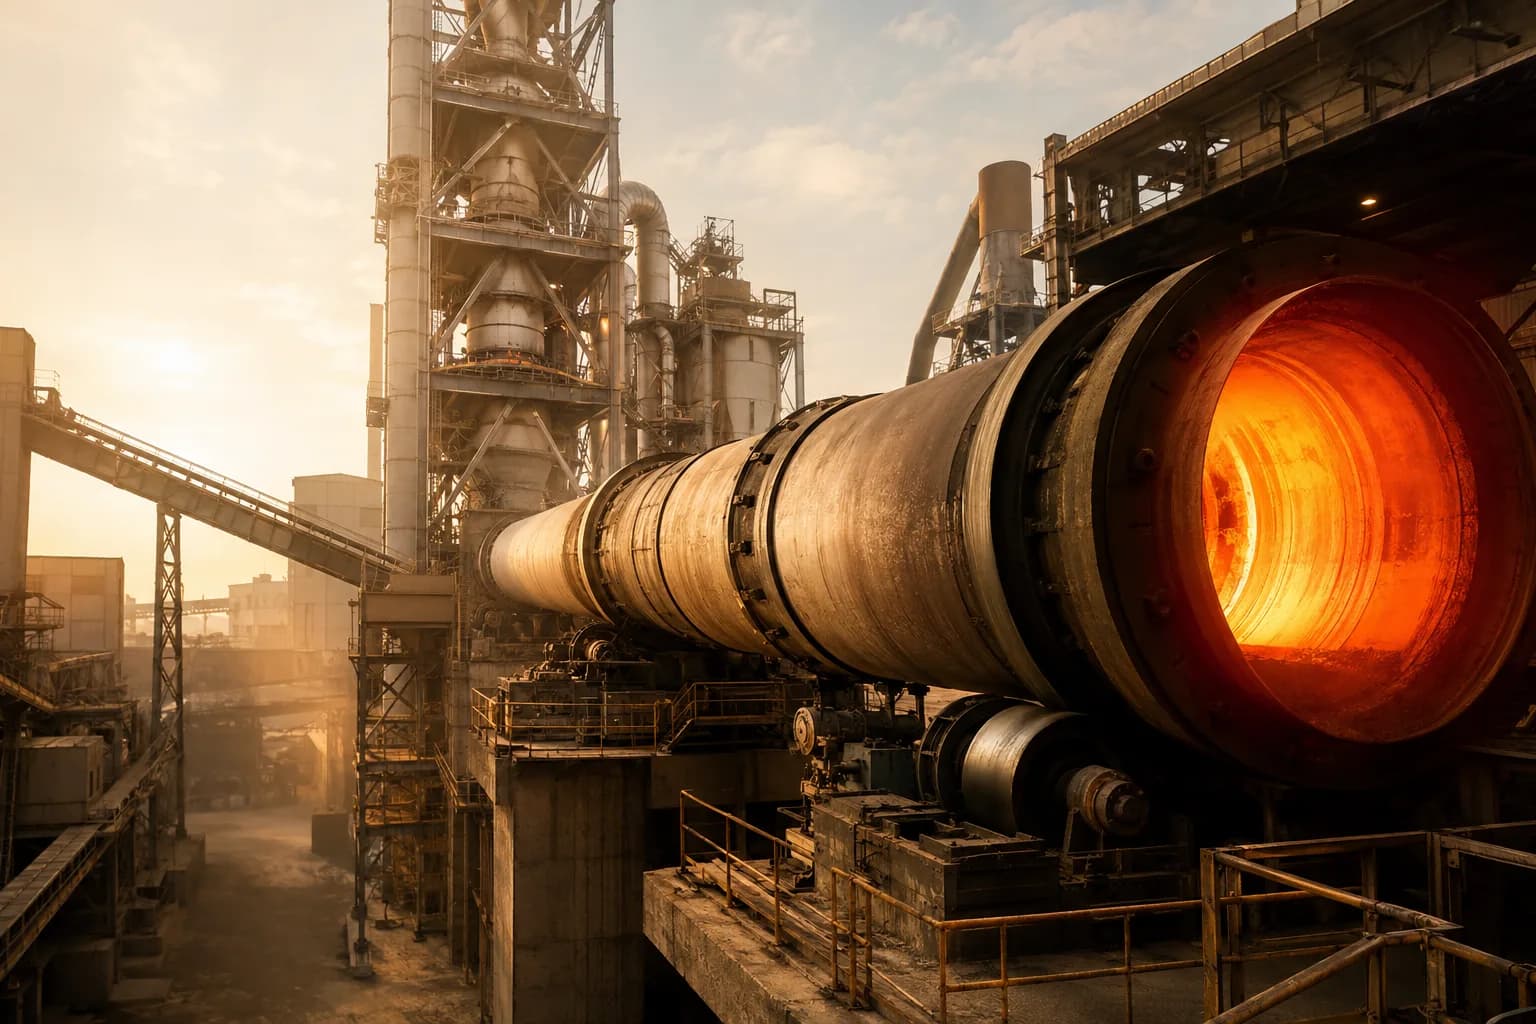
When limestone (CaCO₃) is heated to ~1,450°C in the kiln, it chemically releases CO₂ to form CaO. This single process emission accounts for ~60% of cement's carbon footprint — and energy efficiency upgrades cannot reduce it. Under CBAM, calcination is reported as direct (Scope 1) emissions.
On top of calcination, Indian kilns burn coal or petcoke. Indian OPC typically lands at 0.82–0.95 tCO₂/t. EU defaults assume more — inflating your buyer's CBAM bill.
“Indian PPC and PSC blends have lower clinker ratios than EU defaults assume. Actuals reverse 20–40% of the markup.”
Cement & clinker products covered by CBAM
| CN code | Product | Risk |
|---|---|---|
| 2523 10 | Cement clinker | Very High |
| 2523 21 | White Portland cement | High |
| 2523 29 | Other Portland cement | High |
| 2523 30 | Aluminous cement | High |
| 2523 90 | Other hydraulic cements | Moderate |
OPC, PPC, PSC, clinker — four very different bills.
tCO₂ per tonne of product. Savings calculated vs EU default values.
Representative midpoints. Blended cements (PPC, PSC) sit well below the EU default — that red zone vanishes the moment verified actuals are filed.
| Cement type | India typical | EU average | EU default | Savings with actuals |
|---|---|---|---|---|
| Ordinary Portland Cement (OPC) | 0.82–0.95 | 0.60–0.70 | 1.20 | 20–35% |
| Portland Pozzolana Cement (PPC) | 0.55–0.70 | 0.45–0.55 | 0.90 | 25–40% |
| Portland Slag Cement (PSC) | 0.45–0.60 | 0.40–0.50 | 0.85 | 30–40% |
| Clinker (unblended) | 0.85–1.05 | 0.75–0.85 | 1.35 | 20–30% |
Indian PPC and PSC are leaner than the EU thinks
Blended cements with lower clinker ratios produce 0.45–0.70 tCO₂/t. EU defaults assume 0.85–0.90 tCO₂/t. Verified actuals reverse 25–40% of that markup — on every consignment.
Indian cement regions we serve
Rajasthan
India's largest cement state — UltraTech, JK Cement, Shree Cement
High riskAndhra Pradesh / Telangana
Major cement belt — Penna, India Cements, ACC
High riskMadhya Pradesh
Central India hub — Prism, JK Lakshmi
Moderate riskTamil Nadu
South India corridor — Dalmia, Chettinad, India Cements
High riskGujarat
Port-connected plants — Ambuja, Sanghi
Very High riskKarnataka
ACC, UltraTech, Zuari — significant EU trade
Moderate riskFive steps, one named expert.
Share your factory documents. We deliver an EU-ready, declarant-friendly report — pre-verified by a top-3 EU auditor.
- 01
Process boundary mapping
We map raw meal prep, preheater/precalciner, rotary kiln, clinker cooler and cement grinding — every emission source per CBAM methodology.
- 02
Data collection from existing documents
Electricity bills, coal/petcoke invoices, limestone composition, clinker-to-cement ratio, monthly production logs. No new systems for your team.
- 03
Emission calculation (calcination + combustion)
We compute calcination (limestone → CaO + CO₂) and kiln-fuel combustion using India-specific factors, accounting for clinker ratio, alternative fuels, fly ash and slag blending.
- 04
EU XML at the right CN codes
Your numbers convert to EU CBAM-compliant XML, mapped to the correct CN code per product. First report in under 48 hours.
- 05
Declarant handoff and verifier replies
We coordinate with your EU buyer's Authorised Declarant and answer every verifier query — your buyer relationship stays protected.

What will CBAM cost your shipments?
Pick your product, drop your number — a named CBAM expert sends your estimate on WhatsApp the same day, in your language. No forms, no software, no obligation.
Cement CBAM, in plain English
Is Indian cement affected by CBAM?
▼
What is calcination and why does it matter for CBAM?
▼
How can Indian cement exporters reduce their CBAM cost?
▼
What CN codes apply to cement under CBAM?
▼
Your entire cement CBAM, done for you. Free.
This quarter we handle your full CBAM for free — proving your real clinker ratio on your own kiln, mill and blend, in a buyer-ready report you keep. No commitment beyond this quarter.
Claim your free cement CBAM quarter