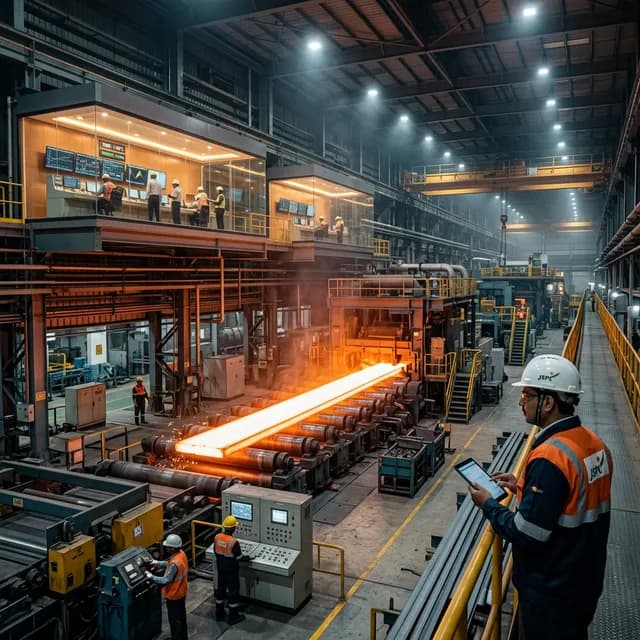
Navigating the EU CBAM: Understanding Per-Tonne Costs for Indian Exporters
The European Union's Carbon Border Adjustment Mechanism (CBAM), established by Regulation (EU) 2023/956, is fundamentally reshaping the landscape for Indian exporters of carbon-intensive goods. This mechanism is not merely an environmental policy; it's a significant financial and operational challenge that requires meticulous planning and execution. For Indian MSMEs and larger manufacturers in sectors like steel, aluminium, cement, and fertilisers, understanding the per-tonne cost implications of CBAM is paramount to maintaining competitiveness in the lucrative EU market.
This comprehensive guide is designed specifically for Indian factory owners, compliance officers, and CFOs. We will demystify the CBAM cost structure, provide practical insights into calculating your potential liabilities, and offer actionable steps to mitigate these costs. Our focus is on empowering Indian businesses, from the bustling industrial hubs of Ludhiana and Gujarat to the manufacturing powerhouses of Pune and Jamshedpur, to navigate this complex regulation effectively.
Key Takeaways
- CBAM is a Carbon Tax: From 2026, Indian exporters will effectively pay a carbon tax on embedded emissions in their goods shipped to the EU, mirroring the EU ETS price.
- Cost Varies by Sector: Per-tonne CBAM costs differ significantly based on the product's embedded emissions and the specific manufacturing process. Steel, cement, aluminium, and fertilisers have distinct emission profiles.
- Data is King: Accurate, granular data on direct and indirect emissions from your Indian factory is crucial to avoid paying higher default values. This includes electricity consumption (from MSEDCL, UGVCL, TANGEDCO), fuel usage, and process emissions.
- Transitional Phase (2024-2025): Currently, it's a reporting-only phase. No financial payments are due, but accurate emission data collection and quarterly reporting are mandatory to prepare for 2026.
- Definitive Phase (Jan 2026 onwards): Financial obligations begin. Importers will purchase CBAM certificates based on reported and verified emissions, directly impacting your product's landed cost in the EU.
- Mitigation is Possible: Investing in energy efficiency, renewable energy, and process improvements can significantly reduce your CBAM liability.
- Expert Support is Crucial: Partnering with an end-to-end CBAM compliance service like CarbonSettle can simplify the entire process, from data collection to verified reporting and strategic cost reduction.
What is the CBAM Cost Per Tonne and How is it Calculated?
The CBAM cost per tonne is the financial levy applied to the embedded greenhouse gas (GHG) emissions of goods imported into the European Union. This cost is directly linked to the weekly average closing price of EU Emissions Trading System (ETS) allowances, expressed in euros per tonne of CO2 equivalent (€/tonne CO2e).
Calculation Mechanics:
- Identify Embedded Emissions: For each tonne of your product (e.g., steel, cement), you must calculate the total embedded direct and indirect GHG emissions (CO2, N2O, PFCs, etc.) expressed in tonnes of CO2 equivalent (tCO2e). This is the most critical and complex step.
- Determine EU ETS Price: The EU ETS price fluctuates. For reporting periods, the average price will be used. As of early 2024, EU ETS prices have ranged from €60 to €90 per tonne of CO2e. Let's assume an average of €75/tonne CO2e for illustrative purposes. This translates to approximately ₹6,750/tonne CO2e (at an exchange rate of ₹90/€).
- Apply the Price: Multiply your product's embedded emissions (tCO2e per tonne of product) by the prevailing EU ETS price.
Formula:
CBAM Cost per tonne of Product = (Embedded Emissions per tonne of Product in tCO2e) × (EU ETS Price per tCO2e)
Example: If your steel product has embedded emissions of 1.8 tCO2e per tonne of steel, and the EU ETS price is €75/tCO2e:
CBAM Cost = 1.8 tCO2e/tonne steel × €75/tCO2e = €135 per tonne of steel
In Indian Rupees, this would be 1.8 tCO2e/tonne steel × ₹6,750/tCO2e = ₹12,150 per tonne of steel.
This cost is significant and directly impacts your product's competitiveness. Indian exporters must meticulously track and report their emissions to avoid paying higher default values, which are often set conservatively by the EU and can be up to 2-3 times higher than actual emissions. For more details on product classification, refer to our CBAM CN code directory.
Understanding Embedded Emissions: The Core of CBAM Costs for Indian Manufacturers
For Indian manufacturers, understanding and accurately quantifying "embedded emissions" is the bedrock of CBAM compliance. These are the greenhouse gas emissions released during the production of your goods, both directly from your factory operations and indirectly from the electricity consumed.
Direct Emissions (Scope 1)
These are emissions from sources owned or controlled by your factory. For an Indian steel plant in Jamshedpur or a cement factory in Gujarat, this includes:
- Fuel Combustion: Burning coal, natural gas, furnace oil, or other fuels in boilers, furnaces, kilns (e.g., for clinker production in cement, or heating in steel rolling).
- Process Emissions: Chemical reactions inherent to the manufacturing process that release GHGs. For example:
- Cement: Decarbonation of limestone (CaCO3 -> CaO + CO2) is a major source.
- Steel: Reduction of iron ore in blast furnaces using coke, or the use of electrodes in electric arc furnaces.
- Fertilisers: Production of ammonia (Haber-Bosch process) and nitric acid.
Indirect Emissions (Scope 2)
These are emissions from the generation of purchased electricity, steam, heating, and cooling consumed by your factory. For Indian manufacturers, this primarily means electricity purchased from the grid.
- Grid Electricity: The carbon intensity of electricity varies significantly across India. For instance, electricity from MSEDCL (Maharashtra) or UGVCL (Gujarat) might have different emission factors depending on the dominant power sources (coal, hydro, solar) in their respective grids.
- Specific Emission Factors: You need to use the specific emission factor for your electricity supplier, if available, or the national/regional average. The EU provides default values, but these are often higher than actual Indian grid factors, making accurate reporting crucial.
Data Collection for Indian Exporters
To accurately calculate embedded emissions, Indian factories must collect granular data, including:
- Fuel Invoices: Quantities and types of fuels purchased and consumed.
- Electricity Bills: Total MWh consumed, ideally with a breakdown of source if available (e.g., if you have a captive renewable plant).
- Production Logs: Daily/monthly output of each product.
- Material Input Data: Quantities of raw materials used (limestone, iron ore, bauxite, etc.).
- Process Parameters: Specific data related to your manufacturing processes (e.g., clinker-to-cement ratio, specific energy consumption).
This data, often scattered across different departments (procurement, production, finance), needs to be systematically gathered and organised. This is where an end-to-end CBAM compliance service like CarbonSettle becomes invaluable, as we help consolidate and structure this data for accurate reporting.
See what CBAM will cost your buyer
Free 30-second check — pick your product and tonnage, get your buyer-side savings number.
CBAM Cost Comparison: Steel, Aluminium, Cement, and Fertiliser
The embedded emissions, and therefore the CBAM costs, vary significantly across different sectors due to distinct raw materials, energy intensities, and production processes. Let's compare the typical ranges for Indian production, keeping in mind that these are illustrative and actual figures will depend on specific factory efficiency and energy mix.
Assumptions for Illustration:
- EU ETS Price: €75/tonne CO2e (approx. ₹6,750/tonne CO2e)
- Exchange Rate: ₹90/€
1. Steel (e.g., Hot-Rolled Coils, Bars)
Steel production is highly carbon-intensive, especially through the traditional Blast Furnace-Basic Oxygen Furnace (BF-BOF) route, which is common in India. Electric Arc Furnace (EAF) steel, particularly if powered by renewable electricity, has lower emissions.
- Typical Embedded Emissions (Indian Context):
- BF-BOF Route: 1.8 - 2.5 tCO2e per tonne of crude steel.
- EAF Route (scrap-based, Indian grid electricity): 0.8 - 1.5 tCO2e per tonne of crude steel.
- Illustrative CBAM Cost:
- For 2.0 tCO2e/tonne steel:
2.0 × €75 = €150 per tonne of steel(approx.₹13,500 per tonne). - For 1.0 tCO2e/tonne steel (more efficient EAF):
1.0 × €75 = €75 per tonne of steel(approx.₹6,750 per tonne).
- For 2.0 tCO2e/tonne steel:
This makes steel one of the most impacted sectors. Indian steel producers in Jamshedpur or Ludhiana must focus on energy efficiency and potentially shifting to greener production methods to reduce this burden.
2. Aluminium (e.g., Primary Aluminium, Aluminium Extrusions)
Primary aluminium production (from bauxite) is extremely energy-intensive, primarily due to the electrolysis process. The carbon footprint depends heavily on the electricity source. Secondary aluminium (from recycling) has significantly lower emissions.
- Typical Embedded Emissions (Indian Context):
- Primary Aluminium (Indian grid electricity): 8 - 12 tCO2e per tonne of primary aluminium (including process emissions and high electricity consumption).
- Aluminium Extrusions (from primary ingots, Indian grid electricity): 0.5 - 1.5 tCO2e per tonne of extrusions (additional processing).
- Illustrative CBAM Cost:
- For 10 tCO2e/tonne primary aluminium:
10 × €75 = €750 per tonne of primary aluminium(approx.₹67,500 per tonne). - For 1.0 tCO2e/tonne aluminium extrusions:
1.0 × €75 = €75 per tonne of extrusions(approx.₹6,750 per tonne).
- For 10 tCO2e/tonne primary aluminium:
The high cost for primary aluminium underscores the need for Indian producers to invest in renewable energy sources or improve energy efficiency.
3. Cement (e.g., Portland Cement, Clinker)
Cement production is inherently carbon-intensive due to the calcination of limestone (process emissions) and the energy required to heat kilns.
- Typical Embedded Emissions (Indian Context):
- Clinker: 0.8 - 1.0 tCO2e per tonne of clinker.
- Portland Cement (blended with fly ash/slag): 0.5 - 0.7 tCO2e per tonne of cement.
- Illustrative CBAM Cost:
- For 0.9 tCO2e/tonne clinker:
0.9 × €75 = €67.5 per tonne of clinker(approx.₹6,075 per tonne). - For 0.6 tCO2e/tonne cement:
0.6 × €75 = €45 per tonne of cement(approx.₹4,050 per tonne).
- For 0.9 tCO2e/tonne clinker:
Indian cement manufacturers in Gujarat or other production hubs can reduce emissions by increasing the use of supplementary cementitious materials (SCMs) like fly ash and slag, and improving kiln efficiency.
4. Fertilisers (e.g., Ammonia, Urea)
Fertiliser production, particularly ammonia (a key precursor), is energy-intensive and involves process emissions. Natural gas is a primary feedstock and energy source.
- Typical Embedded Emissions (Indian Context):
- Ammonia: 1.5 - 2.5 tCO2e per tonne of ammonia.
- Urea (from ammonia): 0.8 - 1.5 tCO2e per tonne of urea (additional processing and CO2 from synthesis).
- Illustrative CBAM Cost:
- For 2.0 tCO2e/tonne ammonia:
2.0 × €75 = €150 per tonne of ammonia(approx.₹13,500 per tonne). - For 1.0 tCO2e/tonne urea:
1.0 × €75 = €75 per tonne of urea(approx.₹6,750 per tonne).
- For 2.0 tCO2e/tonne ammonia:
Indian fertiliser producers need to explore process optimisation and potentially green hydrogen pathways to reduce their carbon footprint and CBAM liability.
Summary Table (Illustrative CBAM Costs per tonne of Product, at €75/tCO2e):
| Product Category | Typical Emissions (tCO2e/tonne product) | Illustrative CBAM Cost (€/tonne product) | Illustrative CBAM Cost (₹/tonne product) |
|---|---|---|---|
| Steel (BF-BOF) | 1.8 - 2.5 | €135 - €187.5 | ₹12,150 - ₹16,875 |
| Steel (EAF, efficient) | 0.8 - 1.5 | €60 - €112.5 | ₹5,400 - ₹10,125 |
| Primary Aluminium | 8 - 12 | €600 - €900 | ₹54,000 - ₹81,000 |
| Cement (Clinker) | 0.8 - 1.0 | €60 - €75 | ₹5,400 - ₹6,750 |
| Cement (Portland) | 0.5 - 0.7 | €37.5 - €52.5 | ₹3,375 - ₹4,725 |
| Ammonia | 1.5 - 2.5 | €112.5 - €187.5 | ₹10,125 - ₹16,875 |
| Urea | 0.8 - 1.5 | €60 - €112.5 | ₹5,400 - ₹10,125 |
This table highlights the significant financial impact of CBAM. For Indian exporters, accurately measuring and reporting actual emissions is not just a compliance exercise; it's a critical cost-saving strategy. Relying on EU default values, which are often higher, could lead to paying up to 40% more in CBAM duties. For a deeper dive into the financial implications, visit our India CBAM Cost Index.
The Crucial Role of Accurate Data in Mitigating CBAM Costs
For Indian exporters, the single most effective way to mitigate CBAM costs is to provide accurate, verified data on their embedded emissions. Why? Because if you cannot provide your actual emissions, the EU importer will be forced to use default values, which are typically set at the higher end of the emission range for that product and production method.
Why Default Values are Detrimental for Indian Exporters
The EU's default values are designed to ensure that importers pay for emissions even without specific data. However, these values are often conservative and may not reflect the actual efficiency of your Indian factory. For example:
- Higher Emission Factors: Default values might assume a more carbon-intensive electricity grid mix than your specific utility provider (e.g., if you are in a region with a higher share of renewables or have invested in captive solar).
- Less Efficient Processes: They might assume less efficient production processes than what your factory actually employs.
- Lack of Granularity: Default values cannot account for specific energy efficiency improvements or material substitutions you have implemented.
By providing your actual, lower emissions data, you can significantly reduce your CBAM liability. This could lead to savings of 20-40% compared to using default values, directly impacting your product's price competitiveness in the EU market.
Operational Steps for Data Collection and Management
- Identify Data Sources: Pinpoint where emission-relevant data resides within your factory (e.g., utility bills from MSEDCL, UGVCL, TANGEDCO; fuel purchase records; production logs; raw material consumption records).
- Establish Data Collection Protocols: Implement clear procedures for regular data collection, ensuring consistency and accuracy.
- Appoint Responsible Personnel: Designate specific individuals or teams within your organisation to oversee CBAM data collection and internal verification.
- Digitise and Centralise: Move away from manual, paper-based records. A centralised digital system can streamline data management and reduce errors.
- Supplier Outreach: For complex goods, you may need to collect data from your upstream suppliers (e.g., for purchased clinker in a cement grinding unit, or specific alloys in an aluminium extrusion plant). This "chasing" of supplier data is a significant challenge for many Indian MSMEs.
- Internal Audit and Review: Regularly review
Compliance disclaimer
Strategies described here are for educational purposes. CBAM regulations (EU 2023/956) evolve quarterly — always verify with your accredited verifier before filing definitive reports.
We’ll do your entire CBAM quarter — ₹0.
A dedicated CBAM expert plus our AI do the whole April–June 2026 report end-to-end: your factory data in, verified actual emissions out — so your buyer pays your real number, not the inflated EU default. The report is yours to keep.
Start your report by 30 September 2026 to claim the free quarter.
Bills, logs, photos — one afternoon.
Verified actuals, EU XML, audit standard.
Yours to keep. ₹0 this quarter.
Prefer to talk? +91 76250 95885 · or run a 30-second savings check first
The complete CBAM guide for Indian exporters
The full compliance roadmap — CN codes, emissions, deadlines, penalties and how to keep your EU orders.
More CBAM guidance for Indian exporters
 Financial Planning
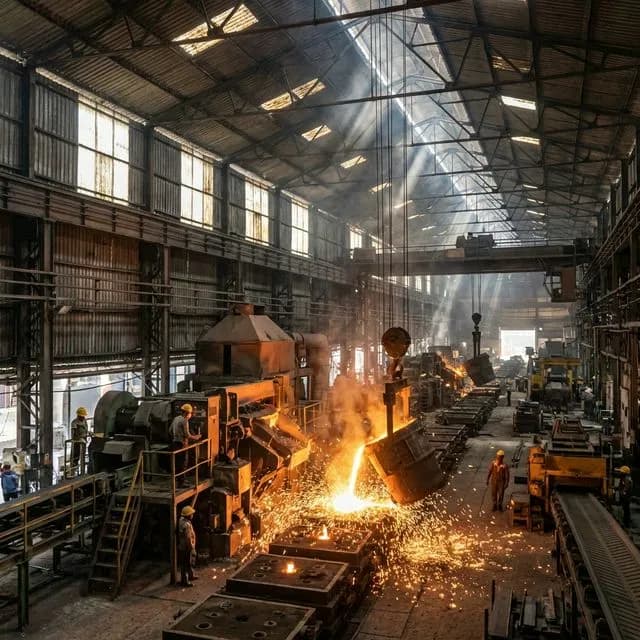
CBAM Certificate Price Today: How the EU ETS Link Sets Your Cost
Indian exporters, understand how the EU ETS carbon price directly impacts your CBAM costs. Learn to calculate and mitigate your financial burden with expert guidance.
 Financial Planning
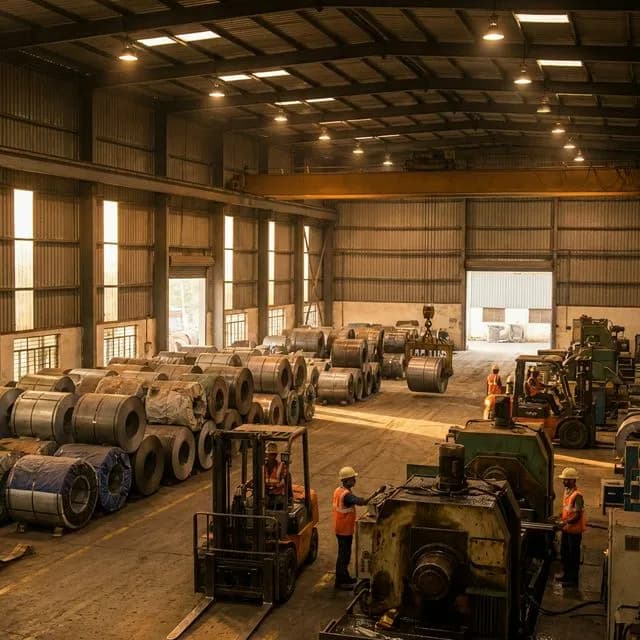
When Does Investing in CBAM Compliance Pay Off? A Break-Even Guide for Indian Exporters
Indian exporters: Understand CBAM compliance costs vs. benefits. Our guide helps MSMEs calculate ROI for CBAM investments and avoid high EU carbon taxes.
 Financial Planning
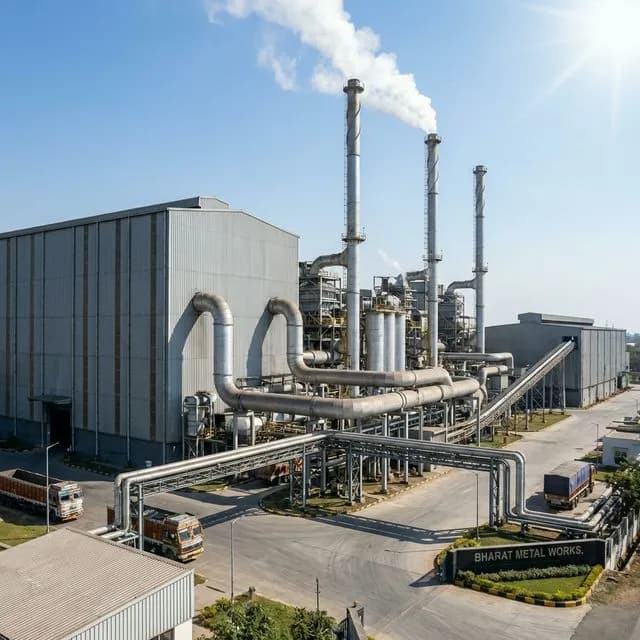
CBAM Verification Cost in India: What Accredited Verification Actually Costs
Demystify CBAM verification costs for Indian exporters. Learn about direct vs. indirect emissions, default values, and how CarbonSettle helps save up to 40% on EU carbon tax.