For Indian manufacturers exporting to the European Union, the Carbon Border Adjustment Mechanism (CBAM) is no longer a distant threat but a present reality. Since October 1, 2023, the transitional phase of Regulation (EU) 2023/956 has mandated quarterly reporting of embedded emissions for specified goods. The definitive phase, starting January 1, 2026, will introduce a financial obligation – a "carbon tax" – on these emissions. For Indian MSMEs in sectors like steel, cement, aluminium, fertilisers, and hydrogen, understanding and actively managing your embedded emissions is paramount to maintaining competitiveness.
One of the most impactful strategies for Indian exporters to significantly reduce their CBAM liability and improve their emission factor is the adoption of solar and other captive renewable power sources. This article provides a high-authority, practical guide on how integrating renewable energy into your operations can directly translate into lower CBAM costs, enhanced market access, and a stronger brand image in the EU. We will delve into the specifics of how these investments impact your CBAM calculations, offer actionable steps for implementation, and highlight how an end-to-end CBAM compliance service like CarbonSettle can simplify this complex journey for you.
Key Takeaways
- CBAM Impact: Captive renewable energy directly lowers your product's embedded emission factor, reducing your future CBAM financial liability.
- Calculation Advantage: Emissions from self-generated renewable electricity are typically zero, drastically improving your CBAM reporting.
- Indian Context: India's abundant solar resources and government incentives make renewable adoption a viable and strategic move for exporters.
- Operational Steps: Accurately track renewable energy generation, consumption, and grid electricity usage for precise CBAM calculations.
- 2026 Financial Savings: Proactive investment now can save Indian exporters millions of rupees in CBAM costs once the definitive phase begins.
- CarbonSettle's Role: CarbonSettle provides end-to-end CBAM compliance services, handling all data collection, emission calculations, reporting, and EU importer coordination, allowing you to focus on your core business.
Understanding Your CBAM Emission Factor: Why Renewables Matter
The CBAM emission factor represents the amount of greenhouse gas emissions (in tonnes of CO2e) embedded per tonne of your exported product. This factor is the cornerstone of your CBAM liability. A lower emission factor directly translates to lower future CBAM costs.
For Indian exporters, the primary sources of emissions in manufacturing processes are often electricity consumption and direct fuel combustion. While direct fuel combustion (e.g., natural gas, coal, furnace oil) has its own emission factors, electricity consumption from the grid often carries a significant carbon footprint. For instance, the grid emission factor for electricity in India, supplied by utilities like MSEDCL (Maharashtra), UGVCL (Gujarat), or TANGEDCO (Tamil Nadu), can be substantial, often ranging from 0.7 to 0.85 tonnes of CO2e per MWh. This figure can vary by state and specific utility mix, but it's rarely negligible.
When you switch from grid electricity to captive renewable power, such as solar PV installations on your factory rooftop in Ludhiana or a ground-mounted solar farm near your plant in Gujarat, the emissions associated with that portion of your electricity consumption effectively drop to zero. This is a critical point: electricity generated from certified renewable sources generally has a zero-emission factor in CBAM calculations, provided it's consumed on-site or directly supplied without significant grid interaction that would reintroduce emissions.
Consider a steel re-rolling mill in Pune or a cement plant in Gujarat. If 30% of their electricity demand is met by captive solar, 30% of their electricity-related emissions are eliminated from the CBAM calculation for their products. This isn't just a marginal improvement; it's a fundamental shift that can significantly alter your product's overall embedded emissions.
How Captive Solar Power Directly Lowers Your CBAM Liability
Captive solar power directly lowers your CBAM liability by replacing high-emission grid electricity with zero-emission renewable energy. When an Indian factory, for example, a ferroalloy producer in Jamshedpur or an aluminium extrusion plant in Bengaluru, installs a solar power plant on its premises, the electricity generated and consumed directly by the factory is considered to have zero embedded emissions for CBAM purposes.
Let's break down the impact with a practical example:
- Scenario 1: 100% Grid Power: An Indian cement factory consumes 100 MWh of electricity to produce 100 tonnes of cement. If the grid emission factor is 0.8 tonnes CO2e/MWh, the electricity-related emissions are 80 tonnes CO2e.
- Scenario 2: 30% Captive Solar: The same factory installs a 3 MW solar plant, meeting 30% of its electricity needs (30 MWh). The remaining 70 MWh (70%) comes from the grid.
- Emissions from captive solar: 30 MWh * 0 tonnes CO2e/MWh = 0 tonnes CO2e
- Emissions from grid power: 70 MWh * 0.8 tonnes CO2e/MWh = 56 tonnes CO2e
- Total electricity-related emissions: 56 tonnes CO2e.
In this simplified example, by adopting just 30% captive solar, the factory reduces its electricity-related emissions by 24 tonnes CO2e. If the CBAM carbon price is, say, €80 per tonne, this represents a saving of €1,920 (approximately ₹1,70,000) for this batch of production. Over a year, for an MSME producing thousands of tonnes, these savings can quickly escalate into lakhs and even crores of rupees.
This direct reduction is a powerful incentive, especially as the definitive phase of CBAM approaches in 2026, when these emission factors will directly translate into financial costs. For a detailed breakdown of potential costs, refer to the India CBAM Cost Index.
See what CBAM will cost your buyer
Free 30-second check — pick your product and tonnage, get your buyer-side savings number.
Operational Steps: Integrating Renewable Data into CBAM Reporting
Accurately integrating renewable energy data into your CBAM reporting requires meticulous data collection and a clear understanding of the methodology. Here are the actionable steps Indian exporters must take:
-
Quantify Renewable Generation:
- Install dedicated meters for your captive solar or wind power plants.
- Record daily, weekly, and monthly generation data (in MWh or kWh).
- Maintain logs of any downtime or maintenance for the renewable system.
- This data is crucial for demonstrating the actual amount of zero-emission electricity consumed.
-
Track Consumption:
- Ensure your factory has separate meters for grid electricity import and captive renewable electricity consumption.
- If the renewable power is directly fed into your factory's internal grid, ensure the total consumption is accurately recorded, and the portion met by renewables is clearly distinguishable.
- For facilities with net-metering arrangements, ensure you track both import from and export to the grid, though for CBAM, the focus is on consumed renewable energy.
-
Calculate Specific Emissions:
- Direct Emissions (Scope 1): Emissions from fuels burned directly on-site (e.g., diesel generators, natural gas furnaces). These are calculated based on fuel consumption and standard emission factors (e.g., from IPCC guidelines or specific Indian government notifications).
- Indirect Emissions (Scope 2 - Electricity):
- Grid Electricity: Multiply the MWh consumed from the grid by the specific grid emission factor for your region/utility (e.g., MSEDCL, UGVCL, TANGEDCO). If a specific factor is unavailable, use national averages or EU default values, though these are often higher and disadvantageous.
- Captive Renewable Electricity: For the MWh consumed from your captive solar/wind plant, use an emission factor of 0 tonnes CO2e/MWh. This is the key benefit.
-
Allocate Emissions to Products:
- This is often the most complex step. You need to allocate the total embedded emissions (direct + indirect) across the specific CBAM-covered products you export.
- This typically involves using mass balance, energy balance, or activity-based allocation methods, depending on the complexity of your production process and the specific product's CBAM CN code directory.
- For example, if a multi-product factory in Gujarat produces both CBAM-covered aluminium extrusions and non-CBAM products, the renewable energy benefit must be correctly attributed to the aluminium extrusions based on their energy intensity.
-
Documentation and Verification:
- Maintain meticulous records of all electricity bills, fuel invoices, renewable generation logs, production volumes, and calculation methodologies.
- These documents will be critical for potential audits and verification by accredited verifiers, especially during the definitive phase.
- For Indian exporters seeking comprehensive support, an end-to-end CBAM compliance service like CarbonSettle can manage this entire documentation and verification process.
2026 Regulatory Impact for Indian Exporters: The Financial Imperative
The transitional period (October 2023 - December 2025) is a reporting-only phase. However, January 1, 2026, marks the beginning of the definitive phase of Regulation (EU) 2023/956, which introduces a direct financial cost for embedded emissions. This is where the strategic advantage of renewable energy becomes a financial imperative for Indian exporters.
From 2026, EU importers will be required to purchase and surrender "CBAM certificates" corresponding to the embedded emissions of the goods they import. The price of these certificates will be linked to the weekly average auction price of EU Emissions Trading System (ETS) allowances, which currently hovers around €60-€100 per tonne of CO2e.
Financial Impact Example:
Let's assume an Indian steel manufacturer exports 10,000 tonnes of steel bars to the EU annually.
-
Scenario A: High Emission Factor (without renewables): If their embedded emission factor is 1.8 tonnes CO2e per tonne of steel (due to reliance on grid power and fossil fuels).
- Total emissions: 10,000 tonnes * 1.8 tCO2e/tonne = 18,000 tonnes CO2e.
- At an average CBAM certificate price of €80/tonne CO2e:
- Annual CBAM cost: 18,000 * €80 = €1,440,000 (approx. ₹12.8 Crores).
-
Scenario B: Lower Emission Factor (with 30% captive solar): Through strategic investment in captive solar and process improvements, they reduce their emission factor to 1.2 tonnes CO2e per tonne of steel.
- Total emissions: 10,000 tonnes * 1.2 tCO2e/tonne = 12,000 tonnes CO2e.
- At an average CBAM certificate price of €80/tonne CO2e:
- Annual CBAM cost: 12,000 * €80 = €960,000 (approx. ₹8.5 Crores).
Savings: In this example, the investment in renewables and emission reduction efforts leads to an annual saving of €480,000 (approx. ₹4.3 Crores). This is a substantial amount that directly impacts the profitability and competitiveness of Indian exports.
Furthermore, if Indian exporters fail to provide verified emission data, EU importers will be forced to use default values, which are typically significantly higher than actual emissions, leading to inflated CBAM costs. CarbonSettle helps Indian exporters avoid these punitive default values, potentially saving up to 40% on their CBAM tax.
The time to act is now. The lead time for installing significant renewable energy capacity can be 6-18 months. Indian MSMEs and larger manufacturers need to assess their energy mix, plan investments, and begin data collection well in advance of 2026 to reap these financial benefits and ensure seamless market access. For a comprehensive guide, visit our CBAM Compliance Guide for Indian Exporters.
Beyond Solar: Other Captive Renewable Options for Indian Exporters
While solar power is often the most accessible and widely adopted renewable energy source in India, especially with abundant sunshine in states like Rajasthan, Gujarat, and Andhra Pradesh, other captive renewable options also offer significant CBAM benefits:
- Captive Wind Power: For factories located in windy corridors (e.g., parts of Gujarat, Tamil Nadu, Maharashtra), captive wind farms can be a viable option. Similar to solar, electricity generated and consumed from captive wind has a zero-emission factor for CBAM purposes.
- Biomass Cogeneration: Industries that generate significant organic waste (e.g., sugar mills, agro-processing units) can invest in biomass-based cogeneration plants. These plants convert waste into electricity and heat, offering both energy cost savings and a low-emission energy source for CBAM calculations, provided the biomass is sustainably sourced.
- Hydroelectric (Small Scale): In hilly regions with perennial rivers, small-scale captive hydroelectric projects can provide a consistent source of zero-emission electricity.
- Waste Heat Recovery: While not strictly a "renewable" source in the traditional sense, waste heat recovery systems capture and convert otherwise wasted heat from industrial processes into useful energy (electricity or steam). This reduces the need for external fuel combustion or grid electricity, indirectly lowering your overall emission factor. The emission factor for the recovered energy would be considered zero, as it's leveraging existing process heat.
The choice of renewable technology depends on geographical location, resource availability, scale of operations, and investment capacity. Regardless of the technology, the principle remains the same: replacing fossil fuel-based energy with zero or low-emission alternatives directly reduces your CBAM burden.
The Role of Energy Efficiency in Conjunction with Renewables
While adopting renewable energy is a powerful strategy, it should be complemented by robust energy efficiency measures. Reducing your overall energy consumption means you need less energy, whether from the grid or from renewables, to produce the same output. This amplifies the benefits of your renewable investments.
For example, an aluminium smelter in Odisha that invests in more efficient furnaces and better insulation will reduce its total electricity demand. If it then installs a captive solar plant, that solar plant will meet a larger proportion of its reduced demand, further lowering the effective emission factor per tonne of aluminium.
Energy efficiency measures can include:
- Upgrading to energy-efficient motors and drives.
- Optimising process controls to reduce energy wastage.
- Improving insulation in furnaces and boilers.
- Implementing LED lighting across the factory floor.
- Regular energy audits to identify areas for improvement.
Combining energy efficiency with captive renewables creates a synergistic effect, leading to maximum CBAM cost reduction and operational savings.
Frequently asked questions
What is the primary benefit of captive renewable power for CBAM compliance?
How does the EU verify the use of renewable energy in CBAM calculations?
Can I claim CBAM benefits for renewable energy purchased from the grid (e.g., green tariffs)?
What are the initial investment costs for setting up captive solar in India, and what are the potential returns?
What happens if I don't accurately report my renewable energy usage for CBAM?
Compliance disclaimer
Strategies described here are for educational purposes. CBAM regulations (EU 2023/956) evolve quarterly — always verify with your accredited verifier before filing definitive reports.
We’ll do your entire CBAM quarter — ₹0.
A dedicated CBAM expert plus our AI do the whole April–June 2026 report end-to-end: your factory data in, verified actual emissions out — so your buyer pays your real number, not the inflated EU default. The report is yours to keep.
Start your report by 30 September 2026 to claim the free quarter.
Bills, logs, photos — one afternoon.
Verified actuals, EU XML, audit standard.
Yours to keep. ₹0 this quarter.
Prefer to talk? +91 76250 95885 · or run a 30-second savings check first
The complete CBAM guide for Indian exporters
The full compliance roadmap — CN codes, emissions, deadlines, penalties and how to keep your EU orders.
More CBAM guidance for Indian exporters
 CBAM Strategy
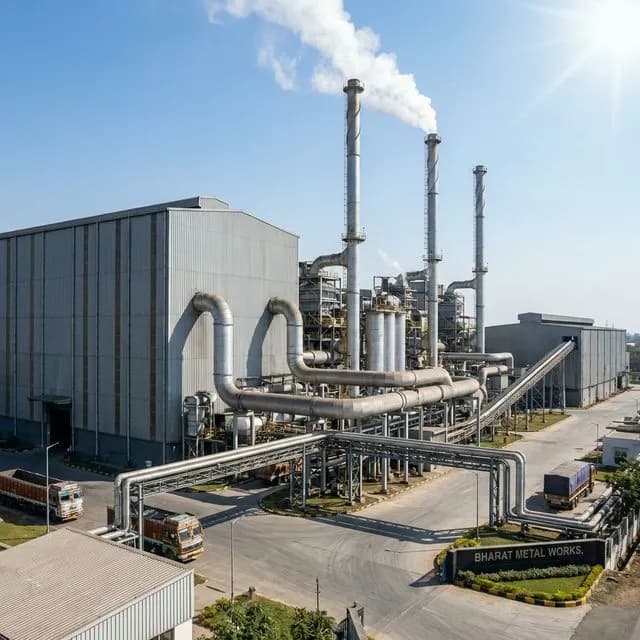
Howrah Foundry Belt: Emission Accounting for West Bengal Iron Casters
Explore emission accounting for iron casters in Howrah, West Bengal, and learn how to navigate CBAM compliance effectively.
 CBAM Strategy
Sponge Iron vs Pig Iron: Emission Intensity Variance and CBAM Liability
Explore the emission intensity differences between Sponge Iron and Pig Iron, and understand their implications for CBAM compliance for Indian exporters.
 CBAM Strategy
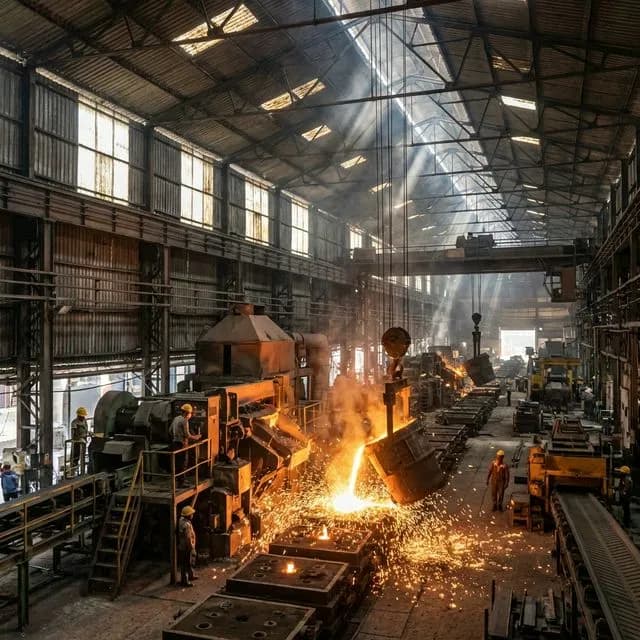
Primary vs Secondary Emission Data: A Field Guide for Indian Factory Managers
Explore the differences between primary and secondary emission data for Indian exporters and learn how to optimize compliance with CBAM.